

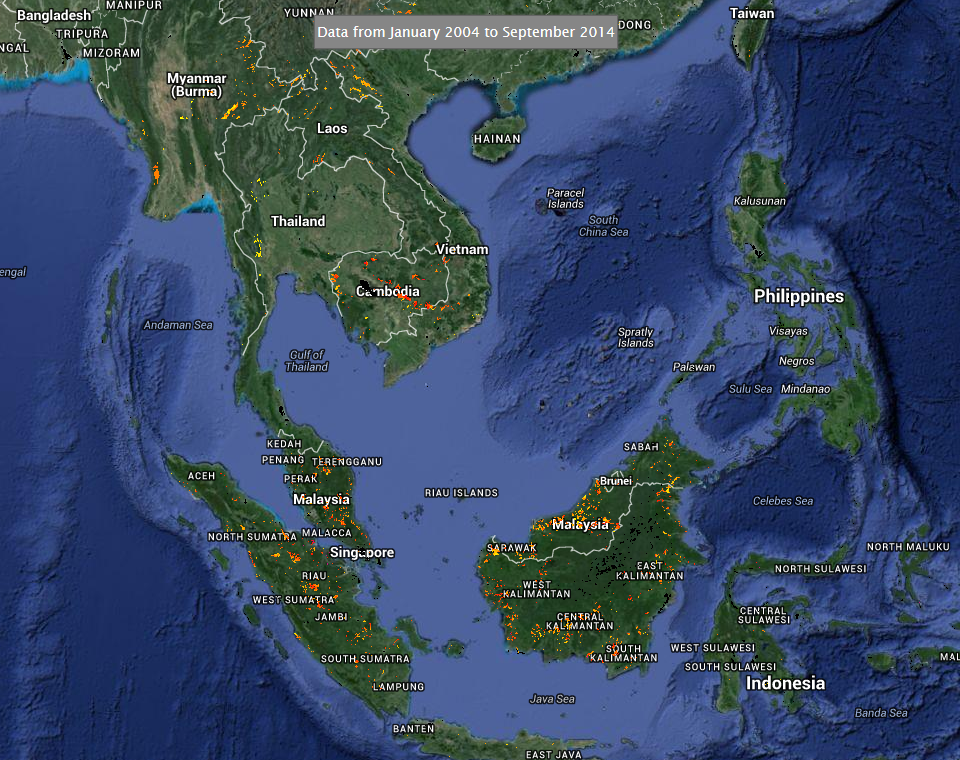
Terra-i data reaching new horizons in the east side of the globe


Globally more than 1 billion people depend on forests for their livelihoods. Forests play a crucial role in climate regulation, ecosystem services provision and regulation, water supply, carbon storage and many other functions that support biodiversity. Currently the global rate of deforestation is substantial, and there is a growing need for timely, spatially explicit data that flag natural vegetation changes due to human activities.
Since the official presentation of Terra-i at the Rio+20 conference in 2012, the system, described in some media as “The First Satellite Deforestation Tracker for Latin America” (see our blog post Terra-i: Strong response to tool’s launch during Rio+20), has been continuously monitoring the land surface of Latin America. It has made its findings freely-available to the public on a regular basis, and it has been an input for numerous analyses, research projects and technical reports, some of them conducted for our more than 1,800 registered users.
On December 2014 at the Global Landscapes Forum the World Resources Institute (WRI) announced the incorporation of CIAT’s Terra-i into the Global Forest Watch platform (see terra-i data in GFW), as part of this partnership Terra-i is now releasing the first version (beta) of the pantropical expansion dataset; in order to achieve this goal the Terra-i team have been working intensively during the last year.
The first step in this expansion process was to acquire a huge MODIS image dataset with data starting from January 2000 until September 2014 (nearly 4,200 Gigabits of data). Using automated processes this task took around 2 weeks of continuous MODIS data downloading.
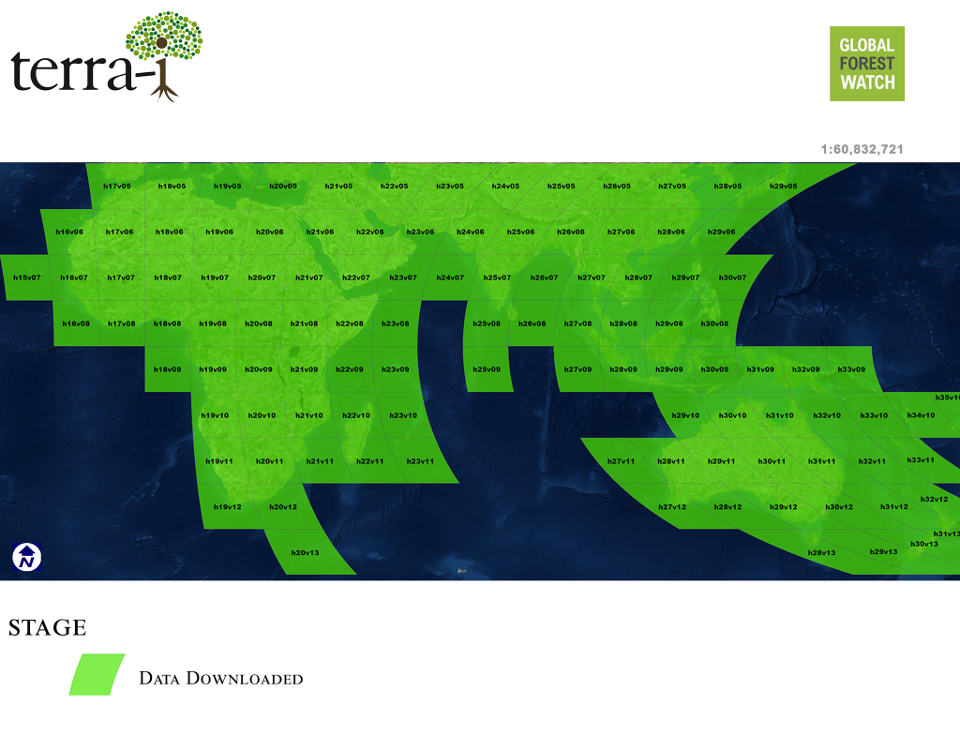
Figure .1 Spatial distribution of MODIS tiles processed in Africa, Asia and Oceania
Once the information was saved, we started the pre-processing stage. This consists of extracting the bands we use from the HDF MODIS files and converting those into compatible formats with Terra-i system. The next step was to process the data to detect vegetation change, and produce maps showing this. The last step was to check the results in order to verify our findings in comparison with other high resolution datasets.
The whole process of downloading, pre-processing, processing and verification takes approximately 16 hours per tile, the equivalent of two working days; the total number of tiles processed was 119, covering Africa (45), Asia (49) and Oceania (25) (Figure 1).
Figure 2 shows the results of the whole area being processed, we also include in this figure Latin America for comparison purposes, thus, the user is able to see the consistency of the data; the figure also indicates three zoom areas in different continents for more detailed visualization of detections.
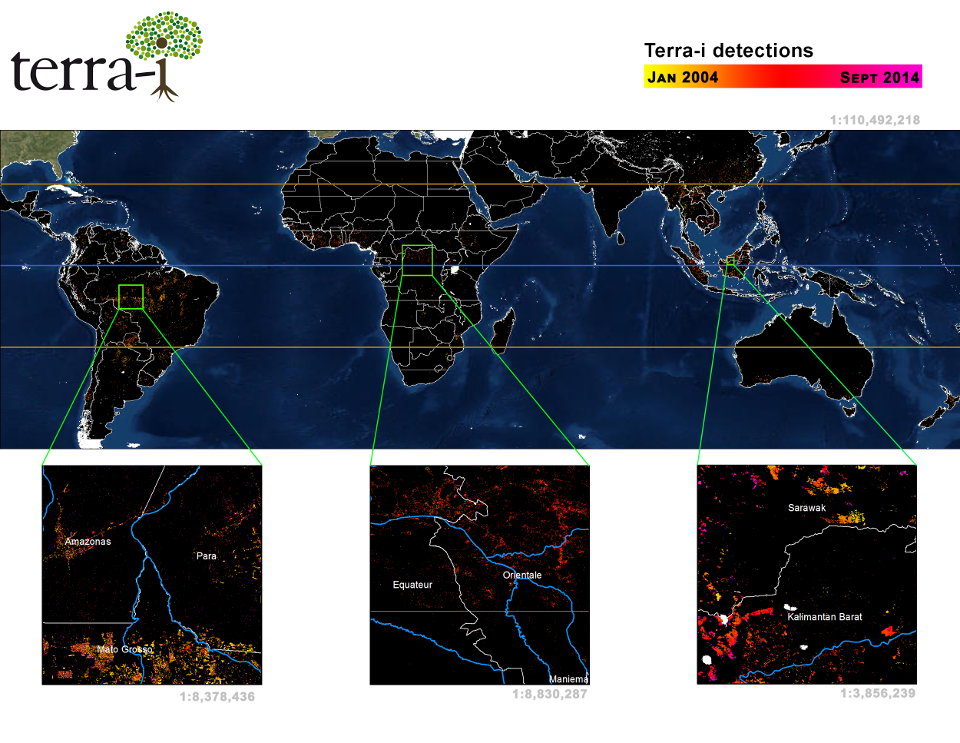
Figure 2. Implementation of terra-i pan-tropically
The obtained data is gladly promising, the verification procedure helped us to identify desirable detection patterns of change, and when compared with Global Forest Change (GFC) a high resolution validated dataset, it was found that results follow similar trends; as expected small areas of change (< 6 hectares) are not detected by terra-i.
The figure 3 parallels GFC and new areas of terra-i data, the display shows similarities in data distribution within a tile, in this image is also possible to identify differences in detections caused by differences in the pixel size between datasets.
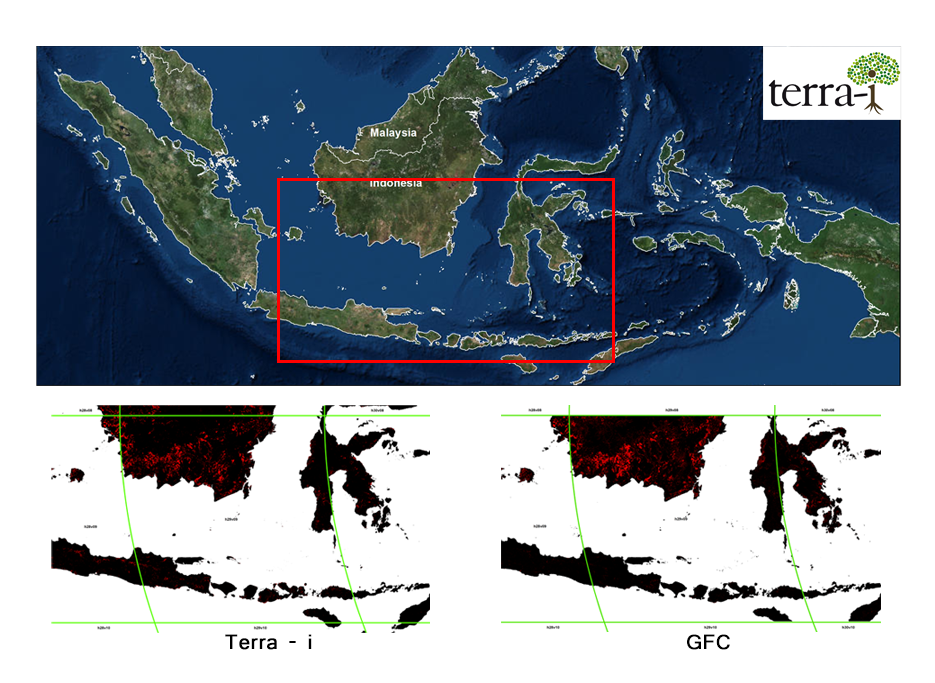
Figure 3. Parallel visualization of terra-i results and Global Forest Change Dataset
These results are part of the first phase of the implementation of Terra-i across the tropics. The next phase will consist of a detailed calibration of these data in combination with the use of high resolution imagery for validation and field activities in zones that we are working to define.
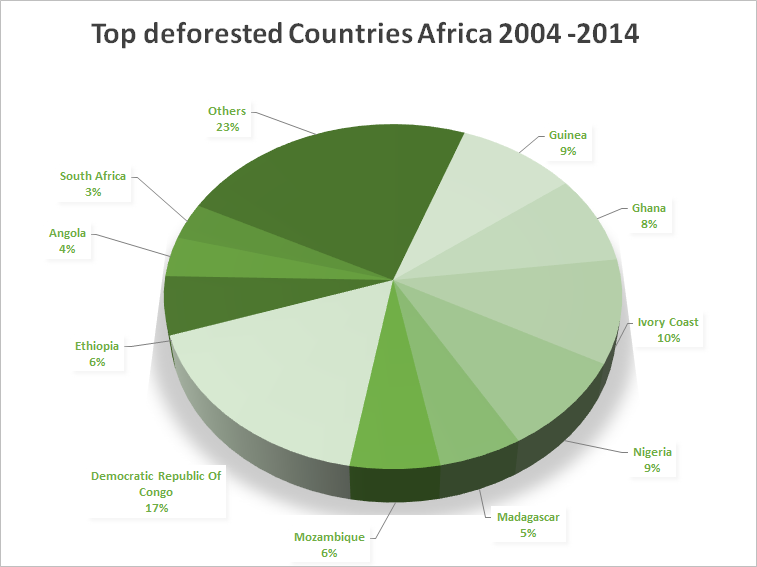
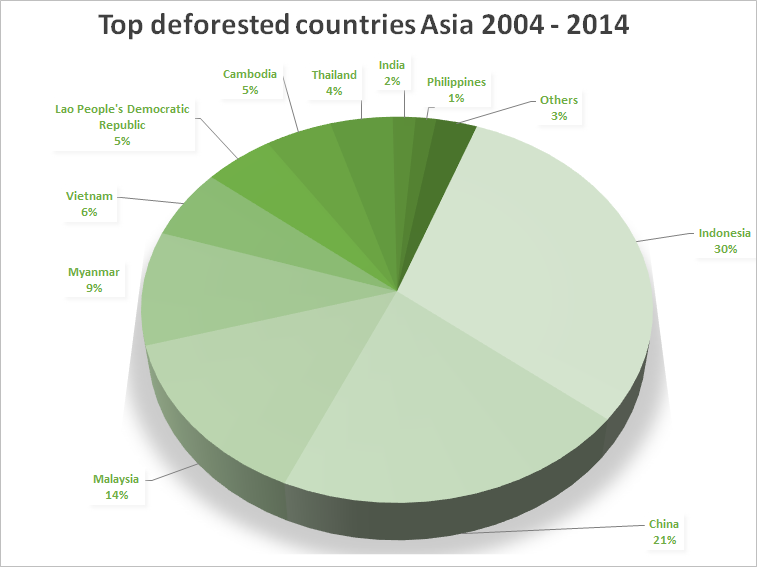
The preliminary continental trends for deforestation for the period January 2004 – September 2014 are shown in figure 4. The most affected countries in each continent are presented in the subsequent figures.
a.
b.
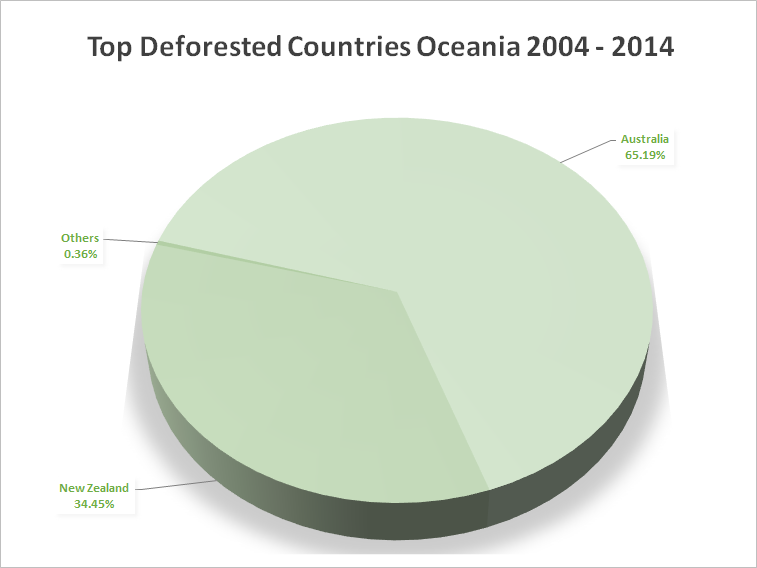
Figure 4. Top deforested countries in a) Africa, b) Asia, c) Oceania
Habitat loss trends are different when looked in relation to the total area of each country (see figure 5) the data highlight the highest annual forest loss rates for each continent.
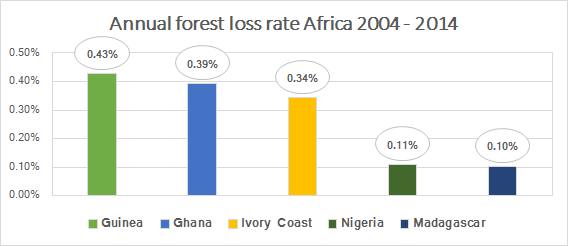

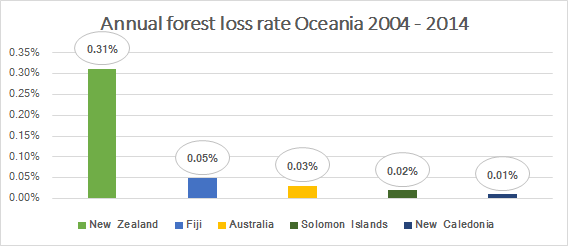
Figure 5. Top deforestation rates by continent
Dynamics of habitat loss differ between countries and continents. The rates of annual forest loss show a different panorama in comparison with the raw data. This is because countries with small areas may be more affected than bigger countries.
Although deforestation has slowed in the last decade, rates remain high in some parts of the world. Furthermore, during the last three decades, most deforestation has taken place in the tropics. By expanding the coverage of Terra-i´s data we aim to improve access to well-timed data that contribute to better decision making.
We recognize the need of our users to have near real time alerts across the tropics. However, as mentioned above the process of obtaining usable and dependable data takes time and dedication. Despite this, the Terra-i team keeps doing their best to accomplish this goal as soon as possible.
The next step in this endeavour is to jointly expand the use of Terra-i by governments in tropical countries, to do so, our team leader Louis will be visiting CIAT’s Asia office in Hanoi, Vietnam, for the entire month of March 2016, to work closely with colleagues there, who have a clearer idea of the vegetation change processes happening in Southeast Asia. This should help guide the successful implementation of Terra-i in the region.
For now a visualization of the beta data will be available online at: www.terra-i.org/terra-i/data/data-statistics.html.
English version prepared with help of Neil Palmer (CIAT).


The Terra-i team together with CRS El Salvador under the Raices project carried out a virtual workshop through the teams platform to technicians from the Ministry of Environment and Natural Resources, CARITAS, Universidad El Salvador, CENTA, about the Mapping of land cover using remote sensors and open source tools such as GEE, SEPAL and QGIS- Plugin Semi Automatic Classification.


Near real-time vegetation loss detection in Southwestern Ethiopia: calibration, validation, and implementation of the Terra-i system


The Alliance of Bioversity International and the International Center for Tropical Agriculture (CIAT) (the Alliance) conducted a training for local stakeholders on the use of Terra-i as part of the collaboration with the Netherlands Development Organisation – SNV in the Coffee Agroforestry and Forest Enhancement for REDD+ (CAFÉ-REDD) Project.


From May 8-12, 2017, the Terra-i team, together with staff from the DGOTA of Peru's Ministry of Environment, carried out the first field validation of vegetative land cover changes detected during Terra-i monitoring for 2016 and 2017, using the technology UAV. This work was carried out under the framework of the project “Sustainable Amazonian Landscapes”. The team carried out over-flights with a Phantom 3 advanced rotor drone and a fixed-wing Ebee drone in seven townships of Yurimaguas. The objective of this work was to recognize the dynamics of land cover and land use changes in the region while at the same time to validate the accuracy of the detections of forest loss being monitored by Terra-i in Yurimaguas.


The Terra-i team has worked hard on renovating Terra-i’s website since early this year. A set of new features on the website provides interactive contents and facilitates adaptation to the mobile devices of our users. The fresh website was developed using the latest update of an open-source, Java-based web system, Magnolia CMS 5.4.4. This update was customized to add different categories of interaction such as news, vegetation cover changes, and information, among others.


The latest update of Terra-i has been used with the Co$ting Nature ecosystem services assessment tool to understand the impacts of recent forest loss in Colombia on biodiversity and ecosystem services.


During the 1st and 12th of June 2015, the Terra-i team, together with the Instituto de Investigaciones de la Amazonía Peruana (IIAP) and the Universidad Nacional Agraria La Molina (VLIR-UNALM), conducted the second field validation of the data produced by the Terra-I system. This time, the study area was the Yurimaguas district, Alto Amazonas province, Loreto region (Peru). We used information on populated places, main roads, rivers and information on land cover changes detected for 2013, 2014 and 2015 to define the 65 sampling points (or Terra-I pixels) for the validation process (Figure 1).
The Terra-i team together with CRS El Salvador under the Raices project carried out a virtual workshop through the teams platform to technicians from the Ministry of Environment and Natural Resources, CARITAS, Universidad El Salvador, CENTA, about the Mapping of land cover using remote sensors and open source tools such as GEE, SEPAL and QGIS- Plugin Semi Automatic Classification.
Near real-time vegetation loss detection in Southwestern Ethiopia: calibration, validation, and implementation of the Terra-i system
The Alliance of Bioversity International and the International Center for Tropical Agriculture (CIAT) (the Alliance) conducted a training for local stakeholders on the use of Terra-i as part of the collaboration with the Netherlands Development Organisation – SNV in the Coffee Agroforestry and Forest Enhancement for REDD+ (CAFÉ-REDD) Project.


IDENTIFICACIÓN DE CAUSAS DE PÉRDIDA DE COBERTURA VEGETAL EN LAS ÁREAS DE INTERVENCIÓN DE LA ACTIVIDAD GOBERNANZA EN ECOSISTEMAS, MEDIOS DE VIDA Y AGUA (USAID/GEMA) EN EL OCCIDENTE DE HONDURAS


MAPEO DE COBERTURAS DE LA TIERRA PARA EL 2017, EN EL OCCIDENTE HONDUREÑO SOBRE ÁREAS DE INTERVENCIÓN DE LA ACTIVIDAD GOBERNANZA EN ECOSISTEMAS, MEDIOS DE VIDA Y AGUA (USAID/GEMA)


CUANTIFICACIÓN DE LA DEFORESTACIÓN EN LAS ÁREAS DE INTERVENCIÓN DE LA ACTIVIDAD GOBERNANZA EN ECOSISTEMAS, MEDIOS DE VIDA Y AGUA (USAID/GEMA) EN EL OCCIDENTE DE HONDURAS


An international team of scientists*, involving entomologists, conservation biologists, agro-ecologists and geographers, has just revealed how on-farm insect biological control can slow the pace of tropical deforestation and avert biodiversity loss on a macro-scale. The case study concerns biological control of the invasive mealybug Phenacoccus manihoti with the introduced host-specific parasitic wasp Anagyrus lopezi in Southeast Asia. The results of this study have just been published in Communications Biology – Nature.
From May 8-12, 2017, the Terra-i team, together with staff from the DGOTA of Peru's Ministry of Environment, carried out the first field validation of vegetative land cover changes detected during Terra-i monitoring for 2016 and 2017, using the technology UAV. This work was carried out under the framework of the project “Sustainable Amazonian Landscapes”. The team carried out over-flights with a Phantom 3 advanced rotor drone and a fixed-wing Ebee drone in seven townships of Yurimaguas. The objective of this work was to recognize the dynamics of land cover and land use changes in the region while at the same time to validate the accuracy of the detections of forest loss being monitored by Terra-i in Yurimaguas.


CIAT and the Terra-i team are pleased to announce the publication of a new study in Paraquaria Natural, the most prestigious journal in Paraguay dedicated to biodiversity and the conservation of nature.
The Terra-i team has worked hard on renovating Terra-i’s website since early this year. A set of new features on the website provides interactive contents and facilitates adaptation to the mobile devices of our users. The fresh website was developed using the latest update of an open-source, Java-based web system, Magnolia CMS 5.4.4. This update was customized to add different categories of interaction such as news, vegetation cover changes, and information, among others.
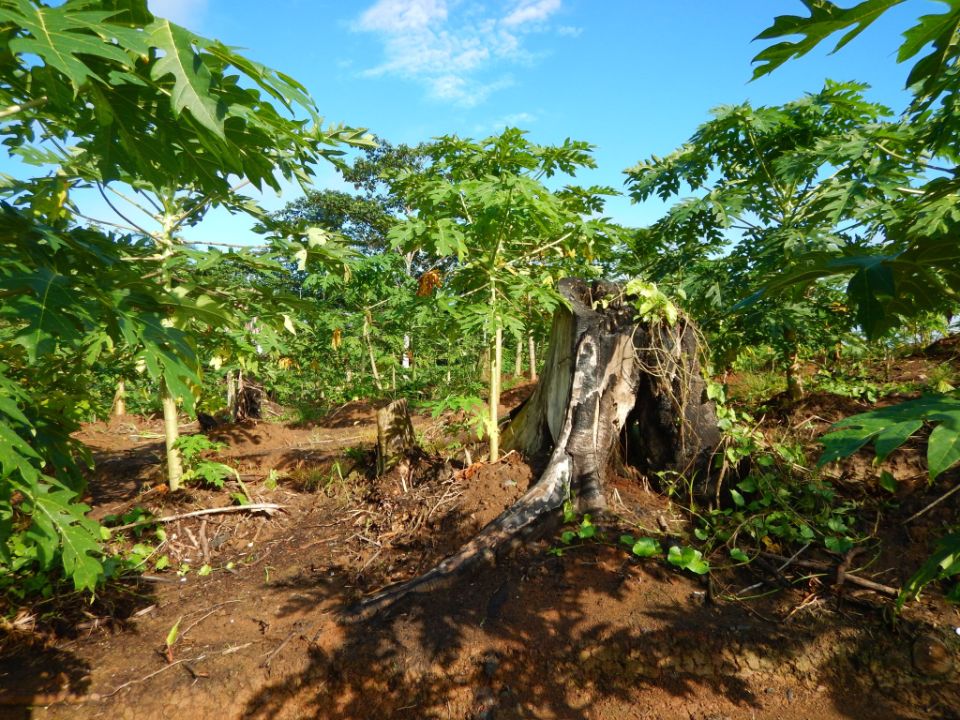

New deforestation hotspots point the finger at my favourite fruit I love Terra-i, but today I hate it. A lot. The system uses satellite images to track deforestation in the Amazon in near-realtime. It’s extremely accurate: if a bunch of trees come down somewhere – no matter how remote – Terra-i picks it up. Cool, right? Not today. CIAT’s Louis Reymondin, the system’s chief architect, dropped the bombshell over coffee: it looks as though hundreds of hectares of rainforest in Peru are being trashed by… papaya.
The latest update of Terra-i has been used with the Co$ting Nature ecosystem services assessment tool to understand the impacts of recent forest loss in Colombia on biodiversity and ecosystem services.


The production of geospatial data related to land-use and land cover changes by governments and civil society organizations has vastly increased during the last decade. Going beyond the valuable information (location, rates and absolute values of changes) provided by these datasets, it is important to have a better understanding of the spatial configurations and composition of the detected change areas at multiple spatial resolutions and time periods. Alejandro Coca-Castro’s research is aiming to map types of spatial deforestation patterns in the Amazon rainforest through the integration of landscape fragmentation metrics and data mining techniques. The research will contribute to the understanding of two deforestation datasets (Terra-i and GFC) and is part of his master dissertation at King’s College London. This blog post highlights Alejandro’s research methodology, preliminary findings and challenges.


Ecuador is recognized as one of the biodiverse hotspots on earth, underneath the Amazon rainforest lies the country’s oil reservoir. With the oil companies and cleared routes come settlers, therefore more and more of this diverse rainforest is being cut down. Since the oil concerns entered the Ecuadorian Amazon 45 years ago, they keep exploring and exploiting the area. The Terra-i detections reveal a total habitat loss of 87,525 Ha, 16,943 Ha (19%) is part of protected areas, between January 2004 and February 2015.